In today’s digital era, efficient logging is the backbone of a robust web application. Systems routinely produce extensive logs that are invaluable for monitoring performance, identifying emerging issues, and steering ongoing improvements. The way you visualize this data can directly impact your team’s effectiveness. A well-designed log dashboard provides the clarity needed to transform raw information into actionable insights that optimize system operations.
Log dashboards act as unified panels, translating extensive log datasets into digestible visuals. Organizations leverage these dashboards to spot anomalies, review usage trends, and take corrective measures in real time, ensuring a seamless user experience. Without centralized visualization, interpreting logs becomes laborious and error-prone, limiting both response speed and overall application health.
The importance of user-centric dashboard design cannot be overstated. A straightforward, thoughtfully designed dashboard empowers developers and stakeholders to efficiently review critical metrics, expediting problem resolution. Investing in such a setup not only minimizes downtime but also supports proactive maintenance strategies, resulting in greater organizational reliability and reduced operational risks.
Choosing the right dashboard configuration is crucial. Since needs vary by business goals and infrastructure, offering features such as customizable views and reliable alert systems helps ensure dashboards deliver genuine value. Indeed, dashboards should evolve as your application grows, scaling functionality alongside user and business requirements.
The Role of Log Dashboards in Web Applications
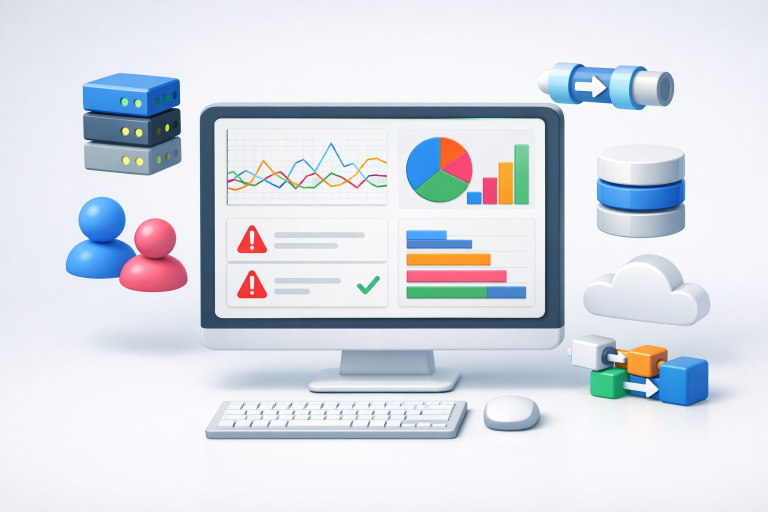
Log dashboards serve as strategic command centers for modern web applications. By consolidating log data from servers, applications, and supporting infrastructure, these interfaces allow for quick detection of errors, system slowdowns, and anomalous activity. Dashboards streamline troubleshooting, supporting both real-time resolution and post-event analysis. Their value lies not only in visualizing current health but also in long-term trend tracking for capacity planning and performance optimization.
Best Practices for Designing Log Dashboards
Successful log dashboards achieve a balance between comprehensiveness and simplicity. The following best practices guide their creation:
- Clarity and Simplicity: Display key performance indicators (KPIs) without overcrowding the interface. Use descriptive labels and avoid unnecessary embellishments to ensure information is accessible at a glance.
- Real-Time Updates: Implement live data feeds to give immediate insights into system health and facilitate rapid incident response.
- Customizability: Empower users to personalize views. Administrators, developers, and executive users often benefit from role-specific dashboards.
- Alerting Mechanisms: Integrate automated notifications for events that require immediate action. Alerts help teams identify and resolve incidents before they escalate, but should be calibrated to avoid overwhelming users with minor or repetitive warnings.
Tools and Technologies for Log Visualization
Adopting the right tools makes log data manageable and insightful. Several platforms have emerged to meet varying visualization and integration needs. Grafana is widely regarded for its versatile data source support and interactive dashboards. Kibana, a core component of the ELK stack, excels at indexing and visualizing large log datasets from Elasticsearch. Sematext Logs offers a powerful, cloud-native log management and analysis service that helps monitor, search, and analyze logs at scale. Their flexible visualizations accommodate everything from error monitoring to application analytics.
Integrating Machine Learning for Enhanced Insights
The evolution of machine learning has introduced a new paradigm for log analysis. Platforms like XpoLog integrate automated analytical tools that not only highlight irregularities but also predict future issues using historical patterns. This significantly reduces manual effort while increasing the accuracy of risk identification. Automated algorithms can proactively flag anomalies even at an early onset, empowering IT teams to resolve issues before they impact end users.
See also: Understanding Business Loan Options for Entrepreneurs
Challenges in Log Dashboard Implementation
Designing and maintaining log dashboards is not without hurdles:
- Data Overload: When dashboards attempt to display every possible log detail, users can become overwhelmed. Filtering for relevance and structuring information logically is essential for usability.
- Alert Fatigue: Frequent or irrelevant alerts diminish their effectiveness. Intelligent systems that prioritize critical issues and reduce noise help teams remain focused.
- Integration Complexity: Sourcing logs from diverse applications, services, and infrastructure can require advanced setup. Robust tools with broad integration capabilities ease this integration challenge and help ensure continuity as systems evolve.
Future Trends in Log Dashboard Design
The landscape of log visualization continues to shift toward advanced analytics and increased automation. Artificial intelligence will soon drive dashboards that not only identify problems but recommend solutions and, in some cases, apply fixes autonomously. Additionally, personalization and improved accessibility are key. Future interfaces will likely feature modular layouts and granular access controls, reflecting the unique priorities of stakeholders from developers to business leaders.
Conclusion
Log dashboards form the core of effective web application management by translating an overwhelming stream of data into coherent, actionable insights. Through thoughtfully designed interfaces, integrated tools, and intelligent alert systems, organizations can diagnose issues quickly, maintain system integrity, and foster constant improvement. By embracing automation and best practices, businesses equip themselves for reliable operations in an increasingly complex web landscape.