Strategic Foundations of Digital Marketing for Home Services
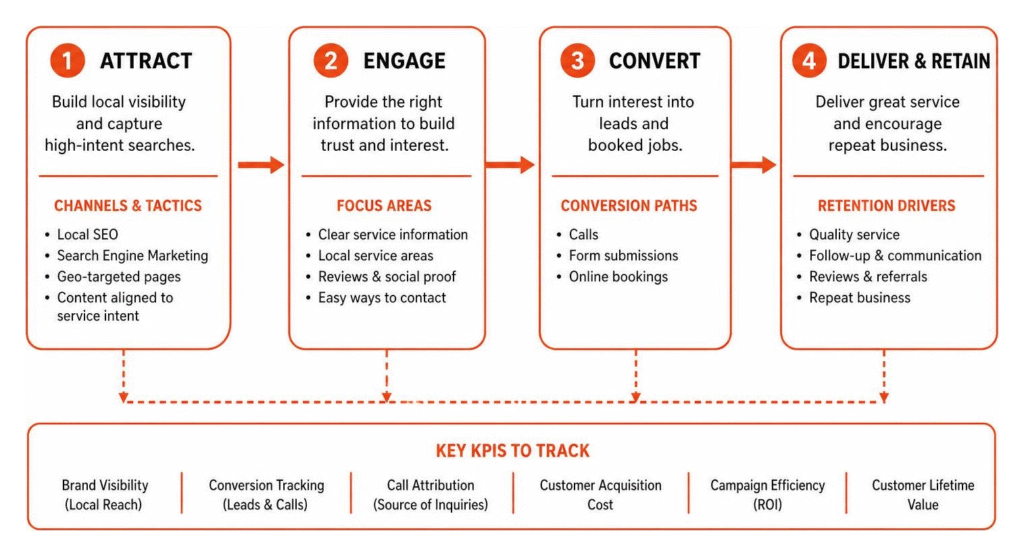
Building a robust digital marketing strategy for your home service business begins with understanding its core foundations. For us, this means focusing on enhancing brand visibility within your local service areas, carefully managing your customer acquisition cost, and skillfully navigating seasonal demand spikes that are common in our industry. Without these strategic pillars, even the best tactics can fall flat.
Aligning Service Offerings with Local Search Intent
In the home services sector, customers often have immediate, high-intent needs. Someone searching for “HVAC services near me” or “plumbing repair in [Your City]” isn’t just browsing; they’re looking for a solution right now. Our strategy must align directly with these high-intent queries. This involves meticulously optimizing your website content and creating geo-targeted landing pages that speak directly to the specific needs of your local customers. For instance, a dedicated page for “emergency furnace repair in Springfield” will perform better than a generic “HVAC services” page when a local homeowner faces a winter breakdown. This precise targeting ensures that when potential customers search, your business is not just visible, but directly relevant to their immediate problem.
Transitioning to Data-Driven Digital Marketing Strategies
The days of guessing what works are long gone. To truly grow your home service business, we must transition to data-driven digital marketing strategies. This means implementing robust conversion tracking to understand where your leads come from, utilizing call attribution to connect phone inquiries back to specific campaigns, and constantly analyzing campaign efficiency. By understanding these metrics, we can optimize our efforts, reduce wasted spend, and ultimately improve the customer lifetime value. This approach allows us to see precisely which marketing activities are generating the most valuable customers, rather than just the most clicks or impressions.
Key Channels and Tactics for Home Service Growth
To achieve comprehensive local reach and capitalize on search volume, a multichannel strategy is essential. We combine various digital marketing avenues to ensure your home service business is visible wherever your potential customers are looking.

Google Business Profile and Local SEO Mastery
For home service businesses, your Google Business Profile (GBP) is arguably your most critical digital asset. We focus on mastering local SEO to ensure your business ranks prominently in the local pack—the top three business listings that appear in Google search results and on Google Maps. This involves proactive customer review management, encouraging satisfied clients to share their experiences. We also ensure absolute NAP (Name, Address, Phone number) consistency across all online directories, which is crucial for search engine trust. Furthermore, accurately setting up your service area helps Google understand where you operate, connecting you with relevant local customers.
Paid Search and Local Services Ads (LSA)
While organic visibility is vital, paid search and Google Local Services Ads (LSA) offer immediate impact. Pay-per-click (PPC) campaigns allow us to target high-intent keywords with precision, driving qualified traffic directly to your website. Google LSA, in particular, is a game-changer for home service providers. These ads appear at the very top of Google search results, often above traditional PPC ads, and feature a “Google Guaranteed” badge, building immediate trust. We meticulously optimize ad copy to highlight your unique selling propositions and manage cost-per-lead to ensure your advertising budget delivers maximum return.
Content Marketing and Customer Engagement
Beyond immediate lead generation, content marketing plays a crucial role in building authority and fostering long-term customer relationships. We develop educational blog content that addresses common homeowner problems and offers valuable solutions. Video tutorials, demonstrating simple fixes or maintenance tips, can establish your business as a trusted expert. Email marketing allows us to nurture leads and stay top-of-mind with existing customers, offering seasonal promotions or maintenance reminders. This holistic approach to content marketing significantly contributes to customer retention and boosts your authority in the local market.
Measuring Performance with Data-Driven KPI Reports
Effective measurement is the cornerstone of any successful digital marketing strategy. For home service contractors, this means moving beyond vanity metrics and focusing on key performance indicators (KPIs) that truly reflect business growth. We use data visualization and establish clear reporting frequencies to conduct thorough ROI analysis, ensuring every marketing dollar is justified.

Differences Between KPI Dashboards and Analytical Reports in Digital Marketing for Home Services
It’s important to distinguish between KPI dashboards and analytical reports, as they serve different but complementary purposes in digital marketing for home services.
KPI Dashboards are typically real-time or near real-time, interactive tools designed for at-a-glance monitoring of operational performance. They provide a quick snapshot of current status, allowing teams to react swiftly to immediate changes. For instance, a dashboard might show today’s call volume, website traffic, or current lead count. They are excellent for operational teams who need to track day-to-day activities and spot anomalies quickly.
Analytical Reports, on the other hand, are more detailed, static documents generated periodically (e.g., weekly, monthly, quarterly). They focus on historical trend analysis, offering in-depth insights into performance over time. These reports often include qualitative analysis, comparisons against benchmarks, and actionable recommendations. They are crucial for strategic decision-making, helping management understand why certain trends are occurring, evaluate the effectiveness of long-term strategies, and plan future initiatives. While a dashboard might show you what is happening right now, an analytical report explains why it happened and what to do next.
Key Performance Indicators vs General Marketing Metrics
Understanding the difference between KPIs and general marketing metrics is fundamental. While all KPIs are metrics, not all metrics are KPIs. KPIs are specific, measurable values that demonstrate how effectively a company is achieving key business objectives. They are directly tied to your strategic goals. General marketing metrics, while useful, might simply describe activity without directly indicating progress towards a core objective.
Here’s a table comparing leading vs. lagging KPIs for home service marketing:
Category Leading KPIs (Predictive) Lagging KPIs (Retrospective) Website Website Traffic (Organic, Paid) Conversion Rate (Website visitors to leads) Average Session Duration Bounce Rate (High bounce rate can indicate poor content/targeting) Advertising Click-Through Rate (CTR) Cost Per Acquisition (CPA) / Cost Per Lead (CPL) Quality Score (for PPC) Return on Ad Spend (ROAS) Customer Number of New Leads Generated Customer Acquisition Cost (CAC) Number of Quote Requests Customer Lifetime Value (CLV) Financial Number of Booked Appointments Net Profit Margin (from marketing-generated sales) Average Job Size (from marketing sources) Revenue Growth (attributable to digital marketing) For example, while “website traffic” is a useful metric, “conversion rate” (website visitors to booked appointments) is a KPI because it directly measures progress towards a revenue-generating goal. Similarly, “cost per acquisition” (CPA) is a crucial KPI for us, as it tells us the efficiency of our spending in acquiring a paying customer.
Step-by-Step Process for Creating Comprehensive KPI Reports
Creating effective KPI reports from scratch requires a structured approach. Here’s how we recommend you proceed:
- Define Your Purpose and Audience: Before you even open a spreadsheet, determine why you’re creating the report and who will read it. An executive summary for the business owner will differ greatly from a detailed campaign breakdown for your marketing team. This clarity will dictate the KPIs, level of detail, and presentation style.
- Set Clear Goals and Objectives: What are you trying to achieve? Increase lead generation by 20%? Reduce customer acquisition cost by 15%? Your KPIs must directly align with these specific, measurable, achievable, relevant, and time-bound (SMART) goals.
- Select Relevant KPIs: Based on your goals and audience, choose the KPIs that will best measure your progress. Refer back to the table above for inspiration. Avoid “metric overload” – focus on the most impactful indicators.
- Identify Data Sources and Ensure Availability: Where will you get the data for each KPI? Google Analytics 4, your CRM, call tracking software, Google Business Profile insights, advertising platforms (Google Ads, Facebook Ads), etc. Ensure you have access to these platforms and that the data is reliable.
- Gather and Integrate Data: Collect the necessary data from your identified sources. For comprehensive reports, you may need to integrate data from multiple platforms into a single reporting tool or spreadsheet.
- Choose Your Reporting Tool: Whether it’s Excel, Google Sheets, a business intelligence (BI) platform like Power BI or Tableau, or a dedicated marketing reporting tool, select one that suits your technical capabilities and reporting needs.
- Structure and Visualize Your Report: Organize your report logically, perhaps by marketing channel, objective, or time period. Use appropriate data visualization techniques—charts, graphs, tables—to make complex data easy to understand. Highlight key trends, comparisons, and progress against targets.
- Add Context and Analysis: Data without context is just numbers. Include brief explanations, insights into what the data means, and why certain trends are occurring.
- Provide Actionable Recommendations: The most valuable part of any KPI report is the “so what?” Based on your analysis, what specific actions should be taken? For example, “Increase ad spend on high-performing keywords” or “Optimize landing page conversion elements.”
- Review, Refine, and Distribute: Before sharing, review the report for accuracy, clarity, and relevance. Get feedback from a trusted colleague. Then, distribute it to your stakeholders according to your defined frequency. Reports should evolve; regularly review them to avoid ‘bloat’ and maintain relevance.
What to Do When Campaign KPIs Turn Red
It’s inevitable: sometimes, a KPI will turn “red,” indicating underperformance against a target or benchmark. When this happens, our first instinct should not be to panic, but to engage in a systematic process to understand and rectify the situation.
- Don’t Panic, Investigate: A red KPI is a signal, not a disaster. It means it’s time to dig deeper. Start by confirming the data’s accuracy. Was there a tracking error? A data source issue?
- Root Cause Analysis: Once data accuracy is confirmed, perform a root cause analysis. Ask “why” five times (the “5 Whys” technique) to uncover the underlying problem. For example, if “leads generated” is red:
- Why are leads down? (Website traffic is down.)
- Why is website traffic down? (Paid ad spend decreased, or ad performance is poor.)
- Why is ad performance poor? (Click-through rate is low.)
- Why is CTR low? (Ad creative is stale, or targeting is off.)
- Why is targeting off? (Audience demographics have shifted, or competitor bids increased.)
- Identify Contributing Factors: Consider all potential influences. Was there a change in market conditions, competitor activity, seasonality, or an internal operational shift?
- Formulate a Hypothesis: Based on your analysis, develop a hypothesis about what’s causing the underperformance and what actions might fix it.
- Develop an Action Plan: Create a clear, actionable plan with specific steps, assigned responsibilities, and deadlines. This might involve:
- Landing Page Optimization: If conversion rates are low, test new headlines, calls to action, or form layouts.
- Ad Creative Refresh: If CTR is low, create new ad copy, images, or video.
- Budget Reallocation: Shift budget from underperforming channels or campaigns to those with better potential.
- Targeting Adjustments: Refine audience targeting in your ad campaigns.
- SEO Audit: If organic traffic is down, conduct an SEO audit to identify technical issues or content gaps.
- Implement and Monitor: Execute your action plan and closely monitor the KPI and related metrics to see if your changes have the desired effect.
- Communicate and Learn: Keep stakeholders informed about the issue, your investigation, and the actions you’re taking. Document what you learn from the experience to prevent similar issues in the future.
Best Practices for Automating and Sharing Marketing Reports
Efficient reporting isn’t just about creating reports; it’s about automating data collection and sharing insights effectively. We leverage various reporting tools to streamline this process, including powerful platforms like Power BI and Google Data Studio.
Here’s a list of essential digital marketing metrics for contractors that we often include in automated reports:
- Website Traffic: Total visits, unique visitors, organic traffic, paid traffic.
- Lead Volume: Total leads, leads by source (website form, phone call, chat, LSA).
- Conversion Rate: Website conversion rate, landing page conversion rate.
- Cost Per Lead (CPL): Overall CPL, CPL by channel.
- Customer Acquisition Cost (CAC): The total cost to acquire a new paying customer.
- Return on Ad Spend (ROAS): Revenue generated per dollar spent on advertising.
- Google Business Profile Performance: Views, searches, calls, website clicks, direction requests.
- Phone Calls: Total calls, unique calls, qualified calls, call duration.
- Online Reviews: Number of new reviews, average rating.
- Booking Rate: Percentage of qualified leads that result in a booked appointment.
- Average Job Value: The average revenue generated per service job.
Ensuring Data Accuracy Across Multiple Data Sources
The integrity of your KPI reports hinges on data accuracy. With multiple digital marketing channels, ensuring consistent and reliable data across all sources is paramount. We implement several best practices:
- CRM Integration: Integrate your CRM (Customer Relationship Management) system with your marketing platforms. This allows for closed-loop reporting, connecting initial lead sources all the way through to booked jobs and revenue.
- Google Analytics 4 (GA4): Properly configure GA4 to track website interactions, conversions, and user behavior. This includes setting up custom events for key actions like form submissions, button clicks, and phone number clicks.
- Phone Call Tracking: Implement a dedicated phone call tracking solution. This assigns unique phone numbers to different marketing channels, allowing you to attribute calls accurately back to the specific ad, keyword, or campaign that generated them.
- Consistent Naming Conventions: Use standardized naming conventions for campaigns, ad groups, and ads across all your advertising platforms. This makes data aggregation and analysis much simpler.
- Regular Data Auditing: Periodically audit your tracking setup and data sources. Check for discrepancies, broken tracking codes, or changes in platform APIs that might affect data collection.
- UTM Parameters: Consistently use UTM parameters on all your marketing links to accurately track traffic sources and campaign performance in Google Analytics.
Presenting Performance Reports to Key Stakeholders
A well-crafted report is only effective if its insights are clearly communicated to stakeholders. When presenting performance reports, we focus on:
- Visual Hierarchy: Use clear headings, subheadings, and white space to guide the reader’s eye. Place the most important KPIs and conclusions at the top.
- Executive Summaries: Start with a concise executive summary that highlights key achievements, challenges, and recommendations. Busy business owners need to grasp the essential takeaways quickly.
- Skimmable Formatting: Employ bullet points, bold text, and color-coding (e.g., green for positive, red for negative performance) to make the report easy to skim and understand.
- Storytelling with Data: Don’t just present numbers; tell a story. Explain the “why” behind the trends and how they impact the business.
- Tailored Content: Customize the level of detail and specific KPIs based on the audience. Executives might need a high-level overview, while marketing managers require granular campaign data.
- Actionable Insights: Always conclude with clear, actionable recommendations based on the data. What should the business do next?
- Interactive Elements (if applicable): If using a dashboard tool, leverage interactive features that allow stakeholders to drill down into data points that interest them.
- Preparation for Q&A: Anticipate questions and be ready to provide further detail or context.
Frequently Asked Questions About Digital Marketing for Home Services
How long does it take to see results from digital marketing for home services?
The timeline for seeing results from digital marketing for home services varies significantly by channel and strategy. For instance, paid advertising channels like Google Ads (PPC) and Local Services Ads (LSA) can often generate immediate traffic and leads within days or weeks of launch. This is because you’re paying for immediate visibility. However, building a strong local SEO presence and achieving high local pack rankings through organic efforts typically takes longer, often several months (3-6 months or more) to show significant improvements, as search engines need time to crawl, index, and rank your content and profile. Content marketing and brand building also contribute to a cumulative campaign momentum that builds over time, yielding greater returns in the long run.
What is the most effective budget allocation for home service marketing?
There’s no one-size-fits-all answer to budget allocation, as it depends on your specific goals, market competition, and current online presence. However, a common approach for home service businesses is to allocate a percentage of their projected revenue to marketing, often ranging from 5-12% for established businesses and potentially higher for aggressive growth. Within that budget, a balanced channel split is usually most effective, combining immediate lead generation (PPC, LSA) with long-term asset building (local SEO, content marketing). Seasonal budget adjustments are also crucial; for example, increasing HVAC ad spend during peak summer and winter months, or plumbing ad spend during colder periods when pipes are more prone to freezing.
How do home service contractors measure digital marketing ROI accurately?
Accurately measuring digital marketing ROI for home service contractors requires a closed-loop tracking system. This means connecting your marketing efforts directly to booked jobs and revenue. Key steps include:
- Closed-Loop Tracking: Implement systems that track a lead from its initial source (e.g., a specific Google Ad or organic search) through to its conversion into a paying customer. This often involves integrating your website, call tracking, and CRM.
- CRM Status Sync: Ensure your CRM system is updated with the status of each lead (e.g., “new lead,” “quoted,” “booked job,” “completed job,” “revenue generated”). This allows you to attribute actual revenue back to specific marketing campaigns.
- Average Job Size Metrics: Track the average revenue generated per job for different service types. This helps in calculating the true value of a lead from a particular marketing channel.
- Lifetime Value Tracking: For long-term ROI, track the customer lifetime value (CLV) to understand the total revenue a customer brings over their relationship with your business, which is especially important for services with repeat business (e.g., HVAC maintenance plans). By subtracting the total marketing cost from the revenue generated by those marketing efforts, and then dividing by the marketing cost, you can calculate your marketing ROI.
See also: Practical Financial Wellness Tips for Everyday Life
Conclusion
Creating effective KPI reports is not just a best practice; it’s a necessity for any home service business aiming for sustainable growth in today’s digital landscape. By meticulously defining your KPIs, understanding the nuances between dashboards and analytical reports, and implementing a robust step-by-step reporting process, you transform raw data into actionable intelligence.
When KPIs turn red, we’ve learned it’s an opportunity for deeper analysis and strategic adjustment, not a cause for alarm. Automating data collection and mastering the art of presenting these insights to stakeholders ensures that your entire organization is aligned and moving forward with continuous optimization. This strategic execution of data-driven marketing decisions will not only enhance your brand visibility and customer acquisition but also pave the way for long-term scaling and success. Embrace the power of KPI reports, and watch your home service business thrive.